
I spent a few minutes on Bluesky yesterday (whose feed is becoming better and better by the day) and saw this post by @luokai.
If you’re a data analyst or need to know enough about data to dabble in it, you might have played with Colab before. The difference here is how much easier it is to use. The flow of ingesting datasets into the program, the real-world use of Gemini to both generate and then fix the Python commands, and the compute itself.
Naturally I had to go in and test it. And it’s March. So the first thing on the docket: import the scores of every Duke men’s basketball game since December 1st.
Since Duke’s leading the NCAA in point differential and win margin, I started there.
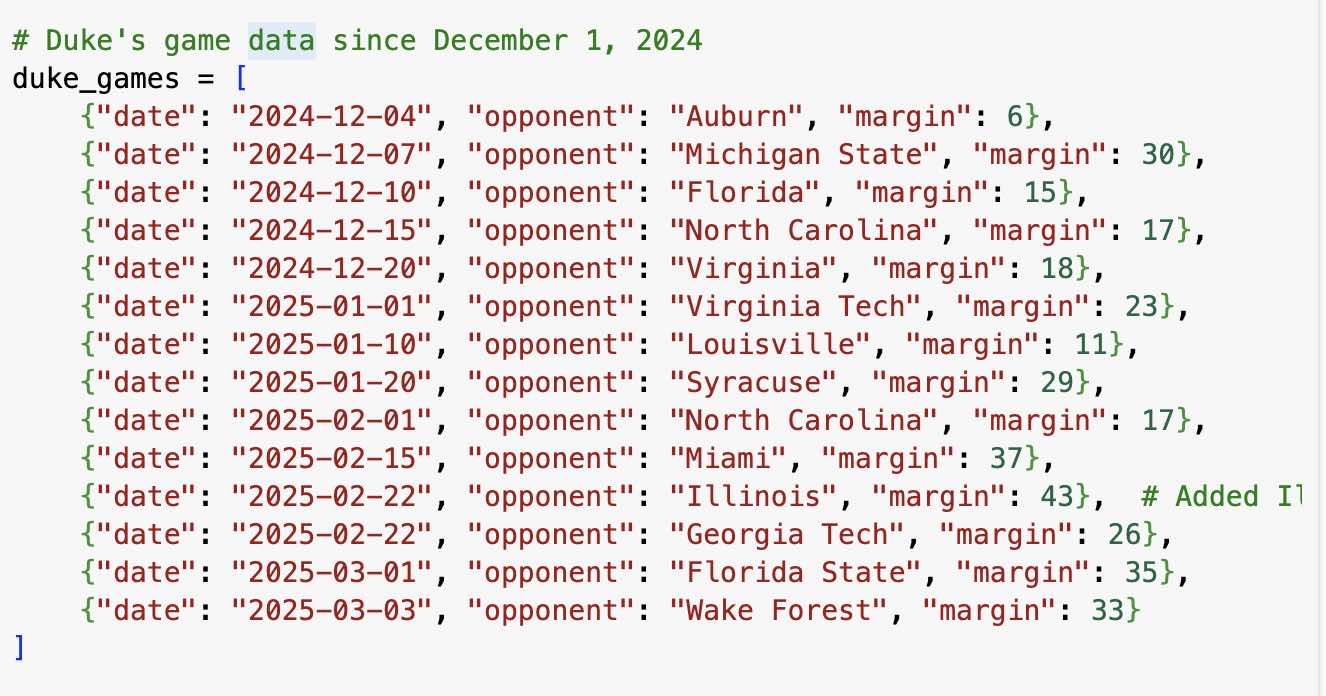
The only place the the flow was clunky was actually in Gemini’s data limitation. Since the current version in Colab can’t search beyond the certain point where its training stopped (March 2024 seemed to be the cutoff for current events) , it naturally couldn’t pull in the data for the past few months. OpenAI was the solution here.
Once the data imported, Gemini’s natural language commands effortlessly built a simple graph of the point margin. This is a small data set, so I wanted to test how Google used its search capability to compare it to data outside the uploaded file and with no context.
How could I underline the margin of victory and give the Gemini integration a real test at the same time?
The answer: Bill Belichick. We have Bill to thank for this. You see, Bill’s dating a 24-year-old woman whose name is Jordan Hudson. But I didn’t know her name at the time I ran this. So I had to prompt it to answer the real question: “Compare the margin of victory to the age of Bill Belichick’s girlfriend.”
Could Google’s Gemini integration take the existing data set, write the code, search and correctly identify who his girlfriend is, do the math on her age, and then add her age as a comparing benchmark to the margin of victory, and run the graph?
Turns out? Yes. it can.
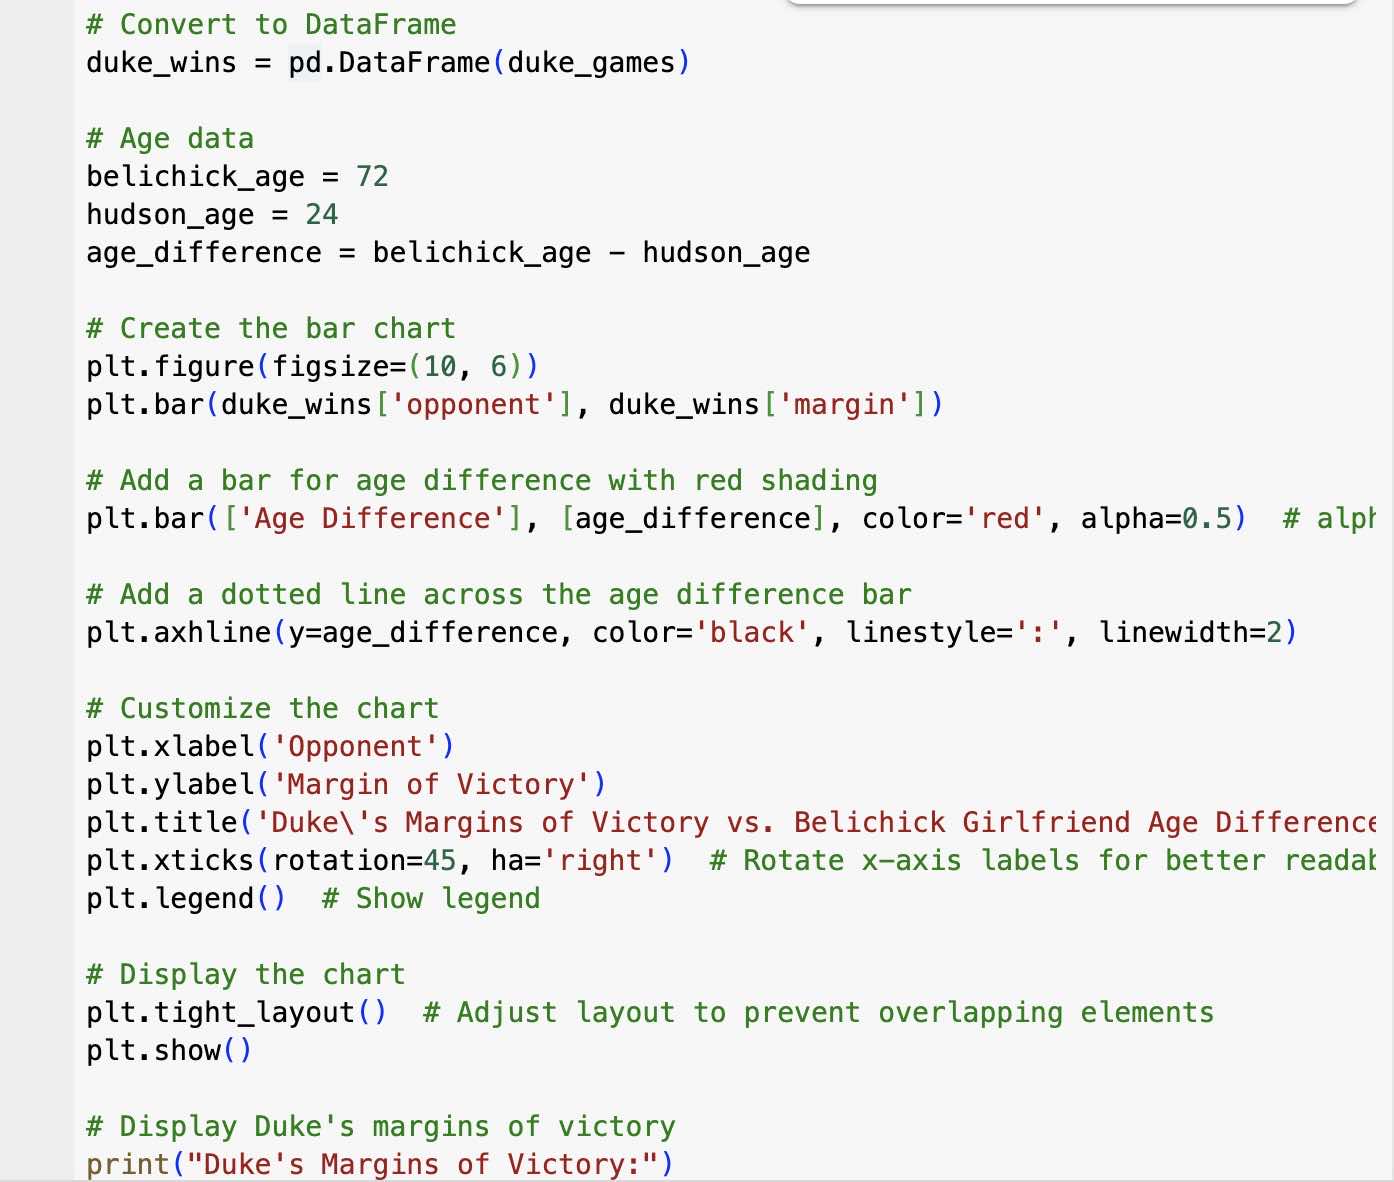
^ Bonus points for correctly labeling her last name (!) in the code description and doing the calculation of age differential – a hilarious detail I didn’t ask for in this version.
Here’s the final graph once I made small manual edits to the code.
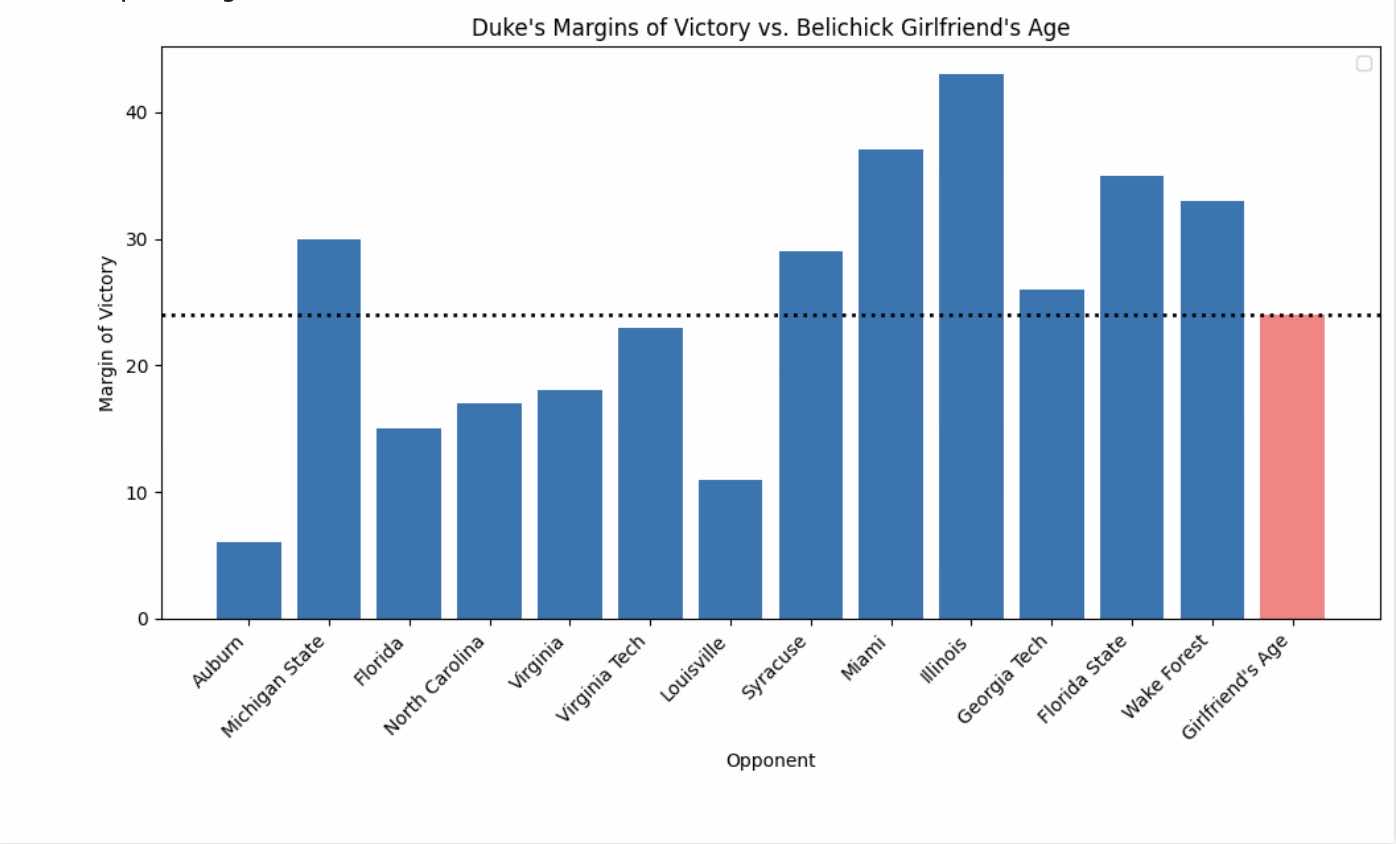
That’s not your eyes deceiving you or your football deflating. In the last six games, Duke’s margin of victory against opponents is over 24.
Joking aside, this is the real utility the people want out of LLMs. Generating images and text is table stakes. But being able to democratize data, app development, and customize models that show small and large-scale insights?
That’s a future that feels somehow more exciting than the helmet catch.
(Sorry Bill.)